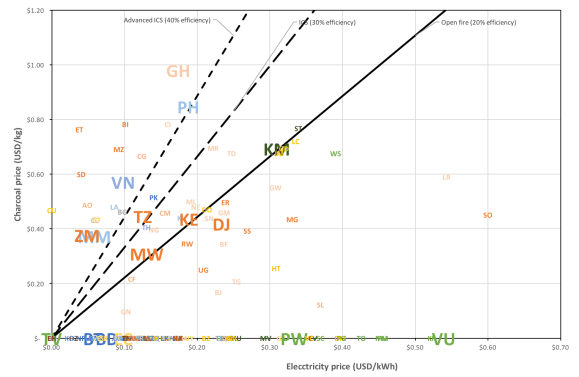
Charcoal price parity.
The figure shows that the market for charcoal is very different. If considering open fires, the majority of countries sit on the right side of the parity line, indicating that users would save money by switching to electricity. However, it should be noted that the charcoal price data (see Appendix 4 – New datasets assembled for the GMA) is the least reliable of all the pricing data, as charcoal markets are usually unregulated and as a result, there are significant variations in the weight of a sack and the quality of charcoal, as well as geographical (e.g. urban/rural) and temporal variations (e.g. rainy/dry season) in price. Ghana and the Philippines represent two of the most attractive charcoal markets, as not only are prices high, but Figure 20 also shows that they have the largest number of users. The picture changes slightly when considering more efficient ICS and even more so with advanced ICS. However, countries with cheap grid electricity and large charcoal burning populations, such as Zambia and Myanmar, still present significant opportunities.

Charcoal market attractiveness
Countries coloured by region: AIMS, Central Africa, Central America & Caribbean, Central Asia & North Korea, East Africa, Europe, India & China, Middle East , North Africa, Pacific Islands & PNG, South America & Mexico, South Asia (excl. India), Southeast Asia, Southern Africa and West Africa. Two-letter country codes listed in the GMA report Regional colour coding and two-letter country codes.
